Batch Processing for Analysis
An automatically generated name “New Batch Run Month Day Year, HH:MM AM/PM”, is assigned to the newly started analysis. You can click the pencil button next to the analysis name, as seen in Figure 3.1, to make the name more identifiable. Without inputting any data, you will not be able to advance through the tabs. Therefore, the first step in the analysis is to input the batch dose-response data.
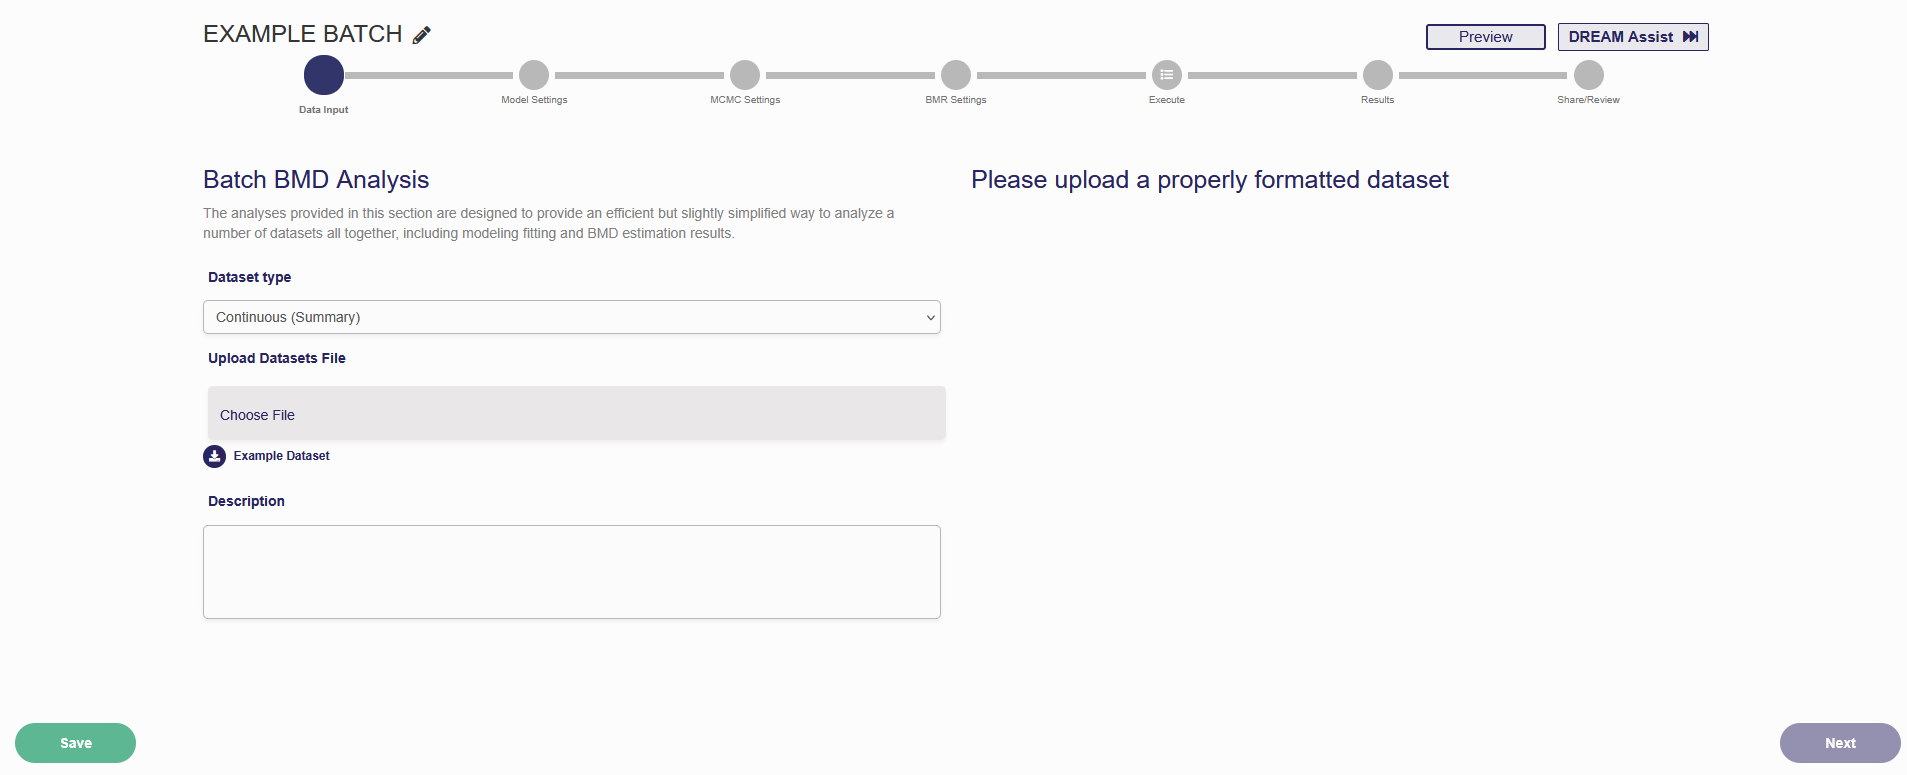
Figure 3.1. Start of a new Batch Analysis
A. Data Input
Note: For data input, a “.csv” file needs to be uploaded. You can click “Example Dataset” to see the required format for each type of dataset.
If you choose to do an analysis on dichotomous data, only dichotomous summary data is allowed. Four columns are required for input (from left to right): Dataset Index, Dose level, number of subjects, number of subjects affected.
If you choose to do an analysis on continuous data, both continuous summary and continuous individual data is accepted. For continuous summary data, five columns are required. The columns (left to right) are Dataset Index, dose level, number of subjects, mean, standard deviation. For continuous individual data, three columns are required (from left to right): Dataset Index, dose level, response.
If you choose to do an analysis on categorical data, four columns are required (left to right): Dataset Index, dose level, severity level, response.
After inputting your dataset, you can add a description to the analysis in the “Description” box. When the dataset is successfully uploaded and a description is added, press “Next” in the lower right corner to advance to the next tab.
B. Model Settings
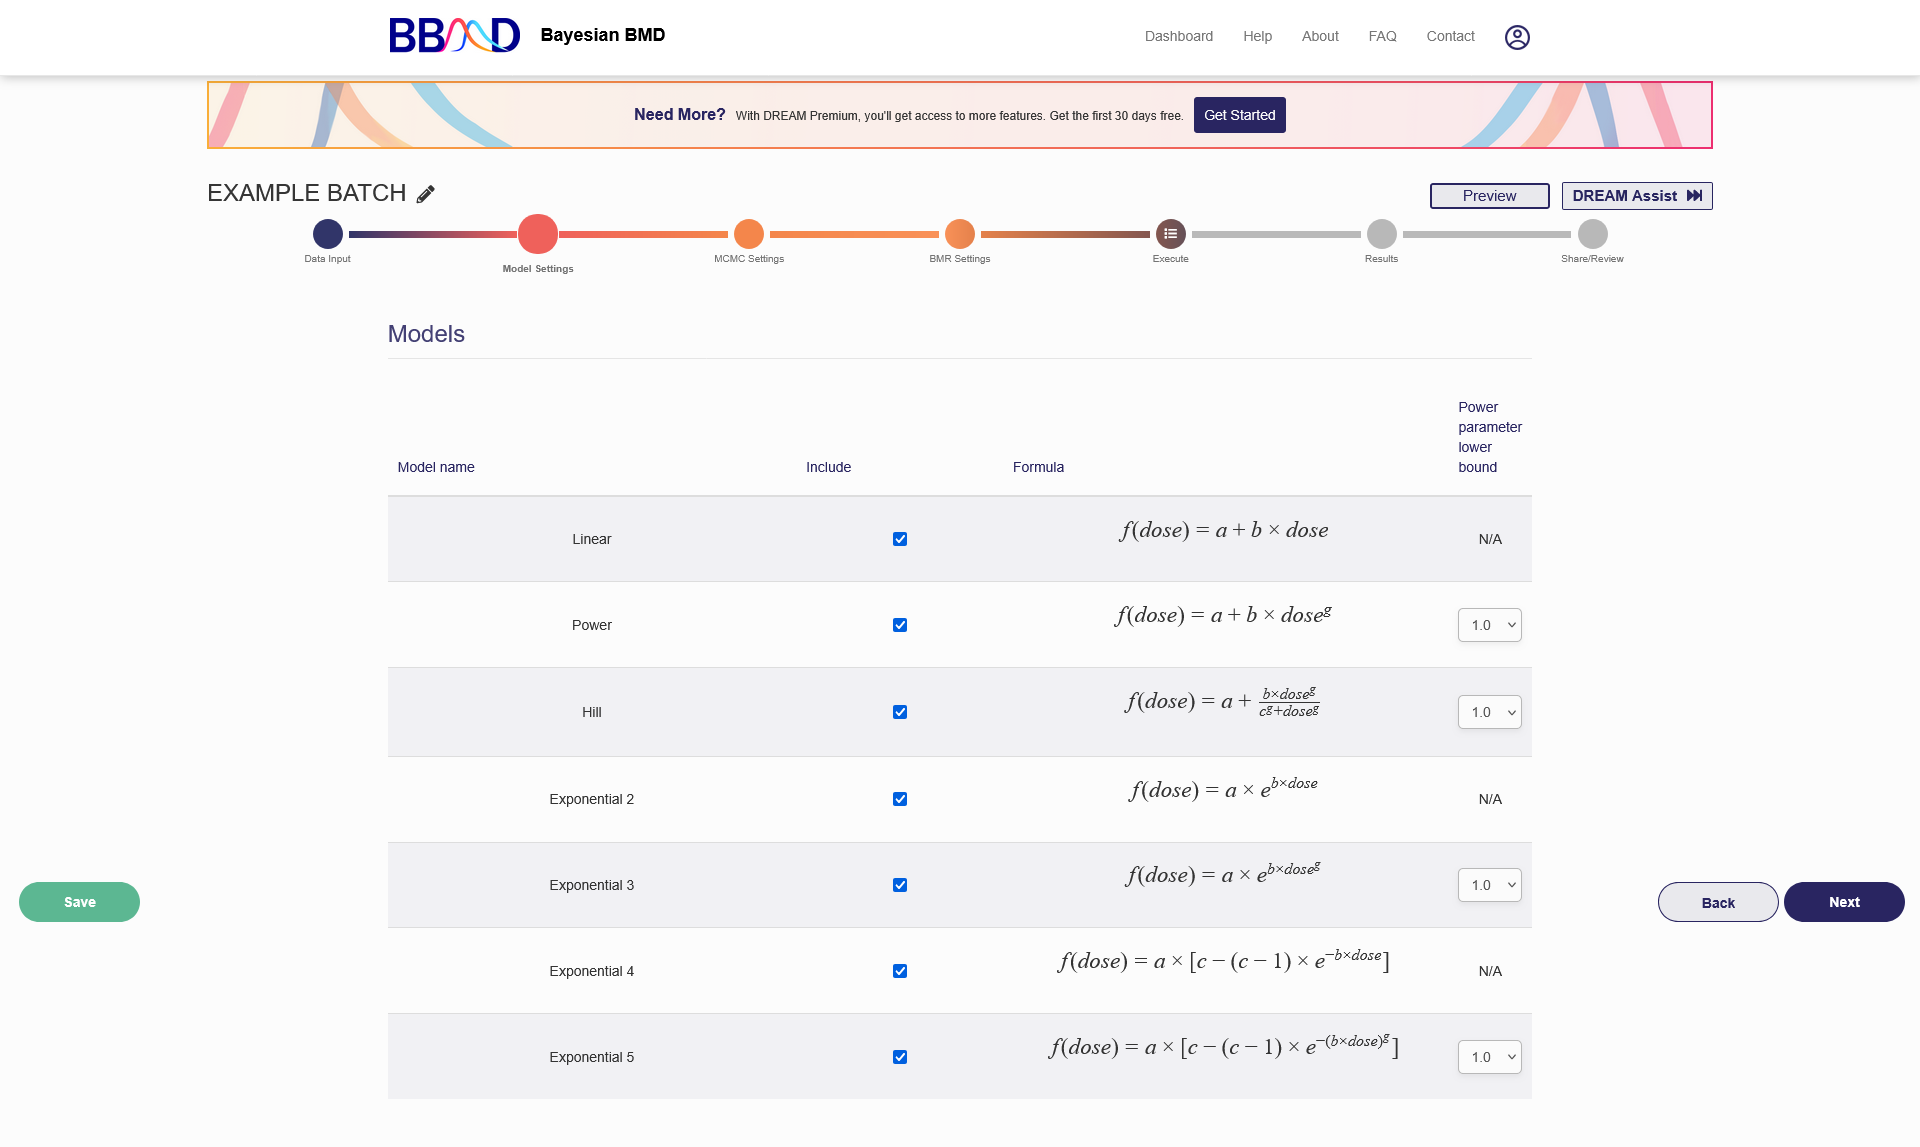
Figure 3.2. “Model Settings” tab
Figure 3.2 shows the “Model Settings” tab, the next step in performing a batch BMD analysis. To include a model in the analysis, ensure that the check box is checked. The model formula is in the next column. For models there is a power parameter lower bound, you can choose a value in the last column. The power parameter lower bound options are 0, 0.25, 0.5, 0.75, and 1.
The models available for each data type are slightly different. For dichotomous data the eight available models are: Logistic, Probit, Quantal Linear, Multistage (2nd Order), Weibull, LogLogistic, LogProbit, Dichotomous Hill. For continuous data the seven available models are: Linear, Power, Hill, Exponential 2, Exponential 3, Exponential 4, Exponential 5. For categorical data the eight available models are Logistic, Probit, Cloglog, Quantal Linear, Multistage (2nd order), Weibull, LogLogistic, LogProbit.
C. MCMC Settings
On this tab you can specify the settings for the MCMC algorithm.
“Iterations” is the length of MCMC chain, i.e., the number of posterior samples in each MCMC chain. Default value is 30,000. The allowable range is any integer between 10,000 and 50,000.
“Number of chains” is the number of Markov Chains to be sampled. Default value is 1. Allowable range is 1 - 3.
“Warmup percent (%)”, the percent of sample in each Markov Chain will be discarded from the final posterior sample. Default value is 50% with an allowable range of 10% - 90%.
So, using the default values, the final number of posterior sample (without the warmup sample) you can get is:
30000 × 1 × (1 − 50%) = 15000
“Seed” is random seed number used in the MCMC algorithms. The number is randomly generated, but you can specify the number for the purpose of reproduction.
Once these values are specified, click “Save” to save the MCMC settings.
D. BMR Settings
The BMR settings tab, shown in Figure 3.3, is where you specify the BMR type and BMR values for the analysis. To add a new benchmark dose calculation, click the plus button on the right side of the right panel. When adding a new BMR, specify either Extra or Added for the benchmark dose calculation, then specify the BMR value. To delete a BMR, click the red trash can button on the right side of the table. You can add up to 4 different BMRs for the analysis.
When you are satisfied with the specified BMRs, either press “Save” in the bottom left corner of the page to save the analysis to come back to later, or press “Execute” in the bottom right corner to execute the batch analysis.
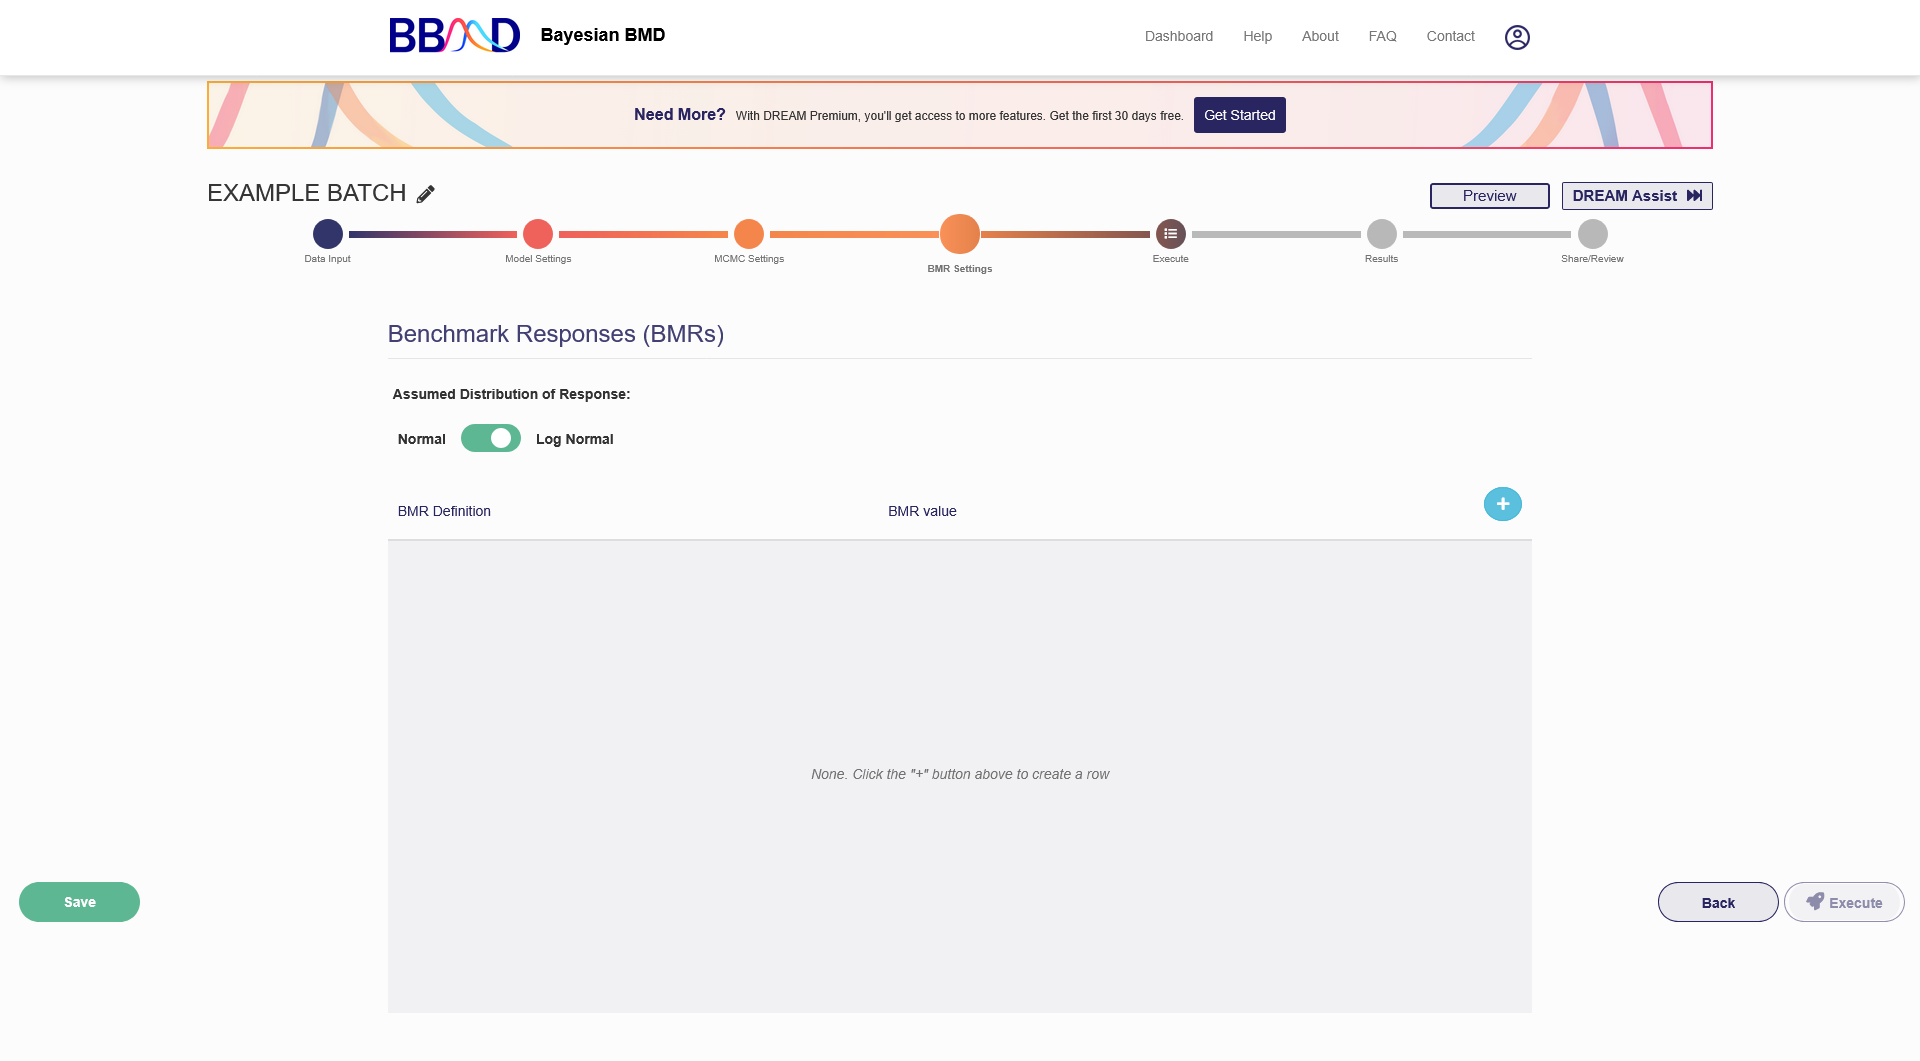
Figure 3.3. “BMR Settings” tab
E. Execute
While the BMD Batch analysis is executing, you may leave the system. When the analysis is completed, you will receive an email notification, and a link to your analysis. Then you will be able to view, share, and export the results.
F. Results
This tab, shown in Figure 3.4, displays the model summaries and BMD summaries for the batch analysis. You can either download the Excel spreadsheet versions of the results or view them in the tables on this page.
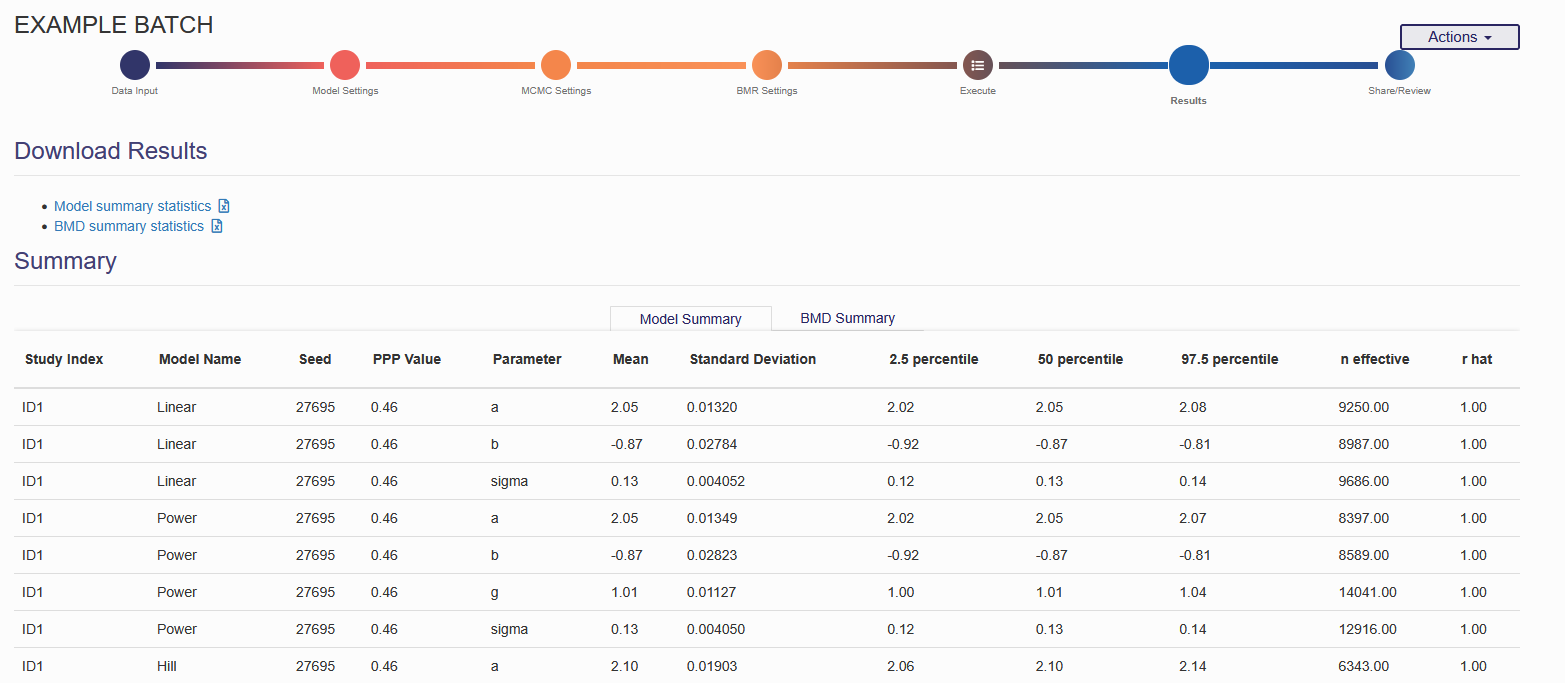
Figure 3.4. “Results” tab for BMD Batch analysis
In the Model Summary table, each model has a row for each parameter in the model. The columns of the table are Study Index (dataset name), Model Name, Seed, PPP Value, Parameter, Mean, Standard Deviation, 2.5 percentile, 50 percentile, 97.5 percentile, n effective, and r hat.
The BMD summary table displays the results for the BMDs specified a couple tabs earlier. The table columns are Study Index (dataset name), BMR Type, BMR Value, Model, model prior weight, model posterior weight, BMDL, BMD, and BMDU.
G. Share/Review
The final tab for this analysis is the “Share” tab, shown in Figure 3.5. By default, all analyses in a personal account can only be accessed by the owner of the account. If you would like to share your analysis with others, you can change the settings from “Private” to “Send Back”, “Share”, or “Dream Assist”. The “Share” setting allows you to send the created URL to others for them to access and review (but not edit) the analysis. The “Send Back” setting allows you to Return to the member that requested the DREAM Assist once reviewed. Lastly, the “DREAM Assist” setting will share this analysis with the DREAM Tech team, who can assist with the analysis. The “DREAM Assist” settings are coming soon.
Like in the previous tab, you can also download the summary Excel spreadsheets for this analysis. There are no differences between the spreadsheets available to download from the “Results” or “Share/Review” tabs.
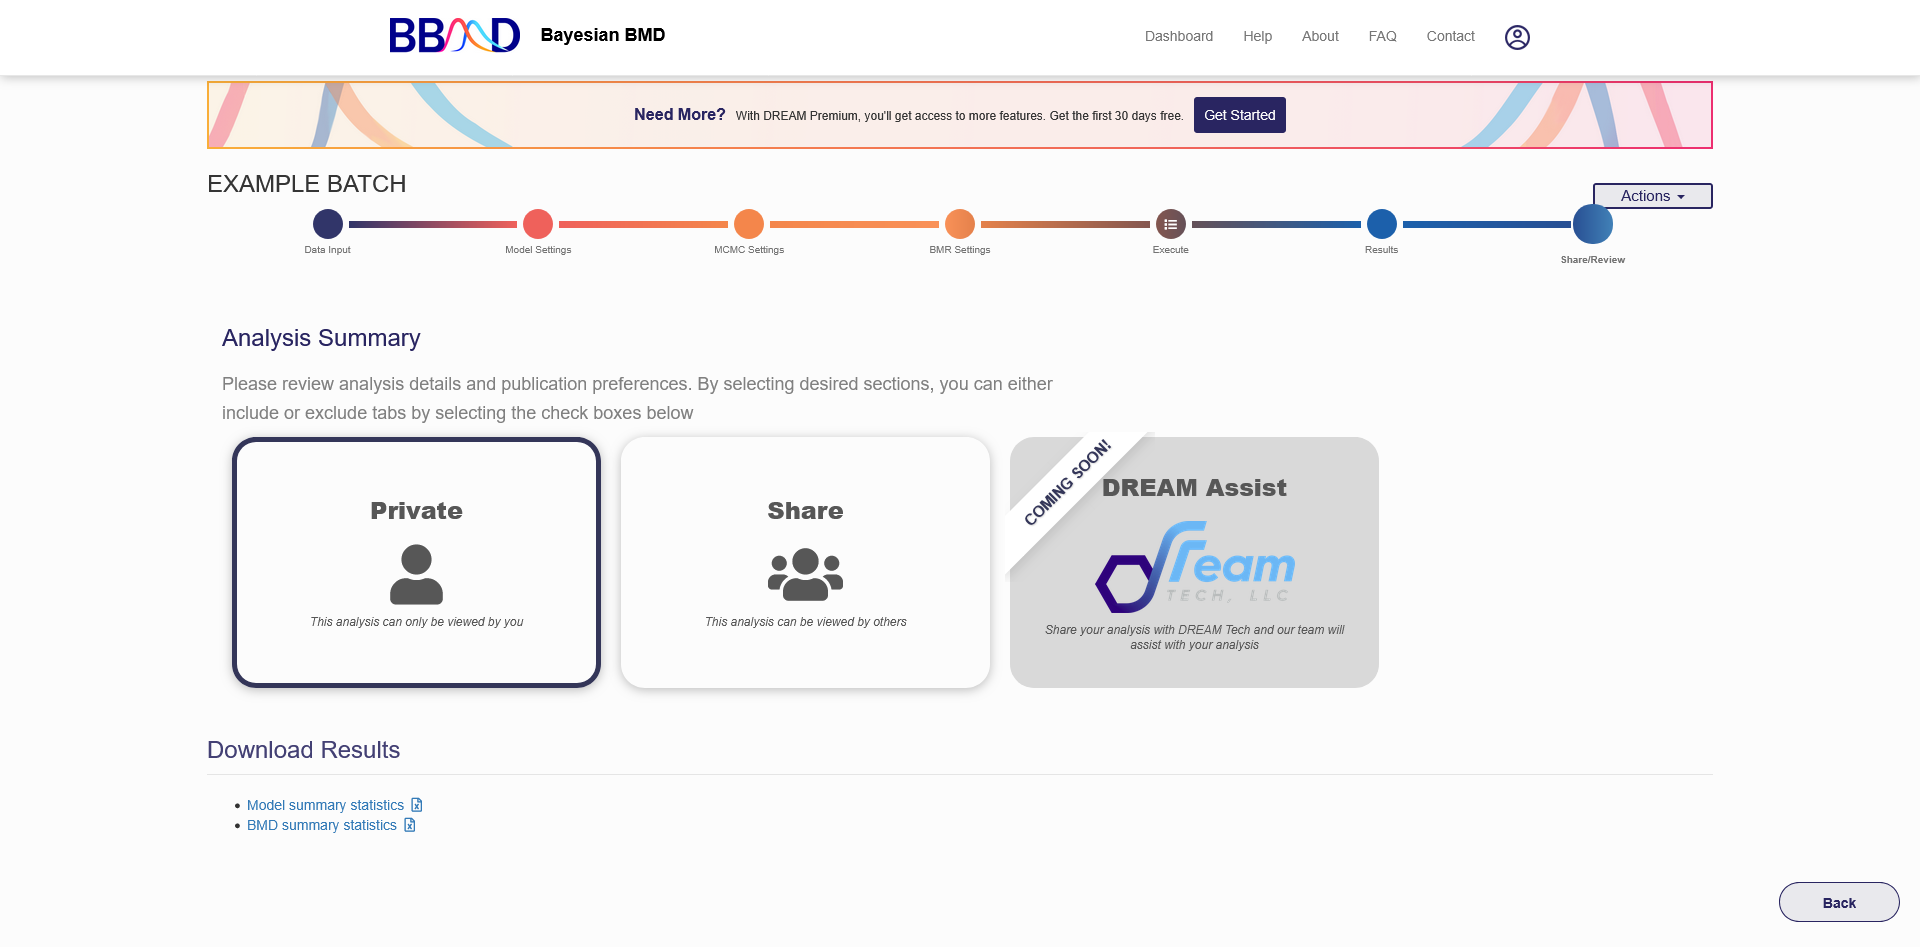
Figure 3.5. “Share” tab for a BMD Batch analysis
