Overview of the BBMD System
Welcome to BBMD, the Bayesian Benchmark Dose Modeling system! BBMD is a robust tool for probabilistic dose-response assessment. Five types of dose-response analysis are available including (a) BMD analysis for single dataset, (b) batch processing for BMD analysis, (c) BMD analysis for genomic data, (d) probabilistic reference dose analysis, (e) BMD analysis for epidemiological data, and (f) Specialty models for multisite tumors and nested dichotomous (coming soon). Each type of analysis is discussed in detail from Sections 2-7. This chapter contains a description of how to assess BBMD, and an overview of the BBMD system.
A. How to Access the System
The URL of the BBMD online system is Bayesian BMD (benchmarkdose.com). Chrome and Firefox are the two recommended web-browsers for using the system. The front page of the BBMD system is displayed in Figure 1.1 below.

Figure 1.1. Front page of the BBMD system
In the upper right-hand corner of the webpage (Figure 1.1), there are five different options. These five options are available on every page of the system. The first option, “Dashboard”, which is where you can access your analyses. This includes analyses you have created and analyses that have been shared with you, which are stored in their respective tabs. The next option in the right corner is “Help”. This link takes you to the download of this user manual, something you must have already figured out. The third option, “About”, is a brief overview on the BBMD system, which gives you 1) a summary of this system, 2) references on the methodology of BBMD, 3) preferred citation of this website, 4) contact info of the DREAM Tech LLC development team for any questions or suggestions, and finally 5) the funding agency. The fourth option, “FAQ”, listed frequently asked questions for BBMD system. The final option in the upper right-hand corner is “Log in”. To use the system for BMD analysis, users first need to either log in to the system.
B. Create and Log in to an account
By clicking the “Log-in” option, the “Log-in” page is shown in Figure 1.2 below. An email address (i.e., the username) and your password are required when logging in. If this is your first time using this system, you will need to create an account by clicking the “Create an account” link at the bottom of the login page shown in Figure 1.2.

Figure 1.2. Login page of the BBMD system
The “Create an account” page is shown in the Figure 1.3. Just like most online systems, an email address (used as an account name) and password, which is entered twice, are needed to create an account. By creating a personal account, your previous analyses will be saved in your account for future review or update. A confirmation email will be sent to your inbox for verification after creating an account. Click on the link in the email to begin using the BBMD software.
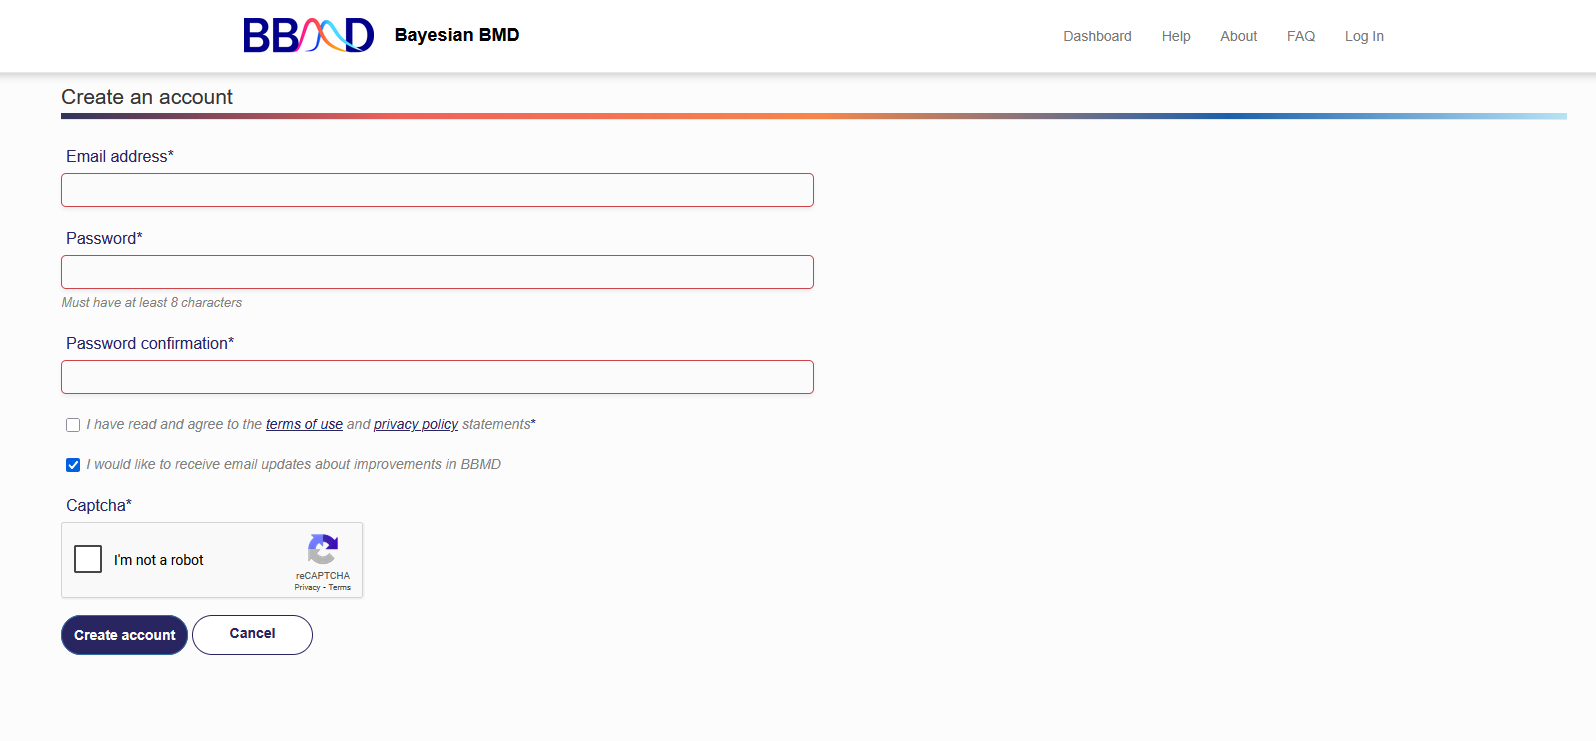
Figure 1.3. “Create an account” Page of the BBMD System
C. The User Dashboard
How to review a previous analysis
Once logged in, you will reach the page with options to access your previous analyses (if any are completed), or analyses shared with you (if you have any) or analyses you shared with the experts from Dream Tech LLC (if you have any) in the respective tabs. If you select one of your previous analyses (e.g., “EXAMPLE” in Figure 1.4), the previous results will be shown as the one is shown in Figure 1.5, you can review the previous analysis. For each type of analysis, there are unique tabs available. By clicking each of the tabs, you can access the data or settings stored in this analysis. One or more tabs may be empty, which indicates that the analysis was previously ended before the corresponding section had been finished. The detailed information regarding the contents in each of the tabs will be introduced in the following sections.
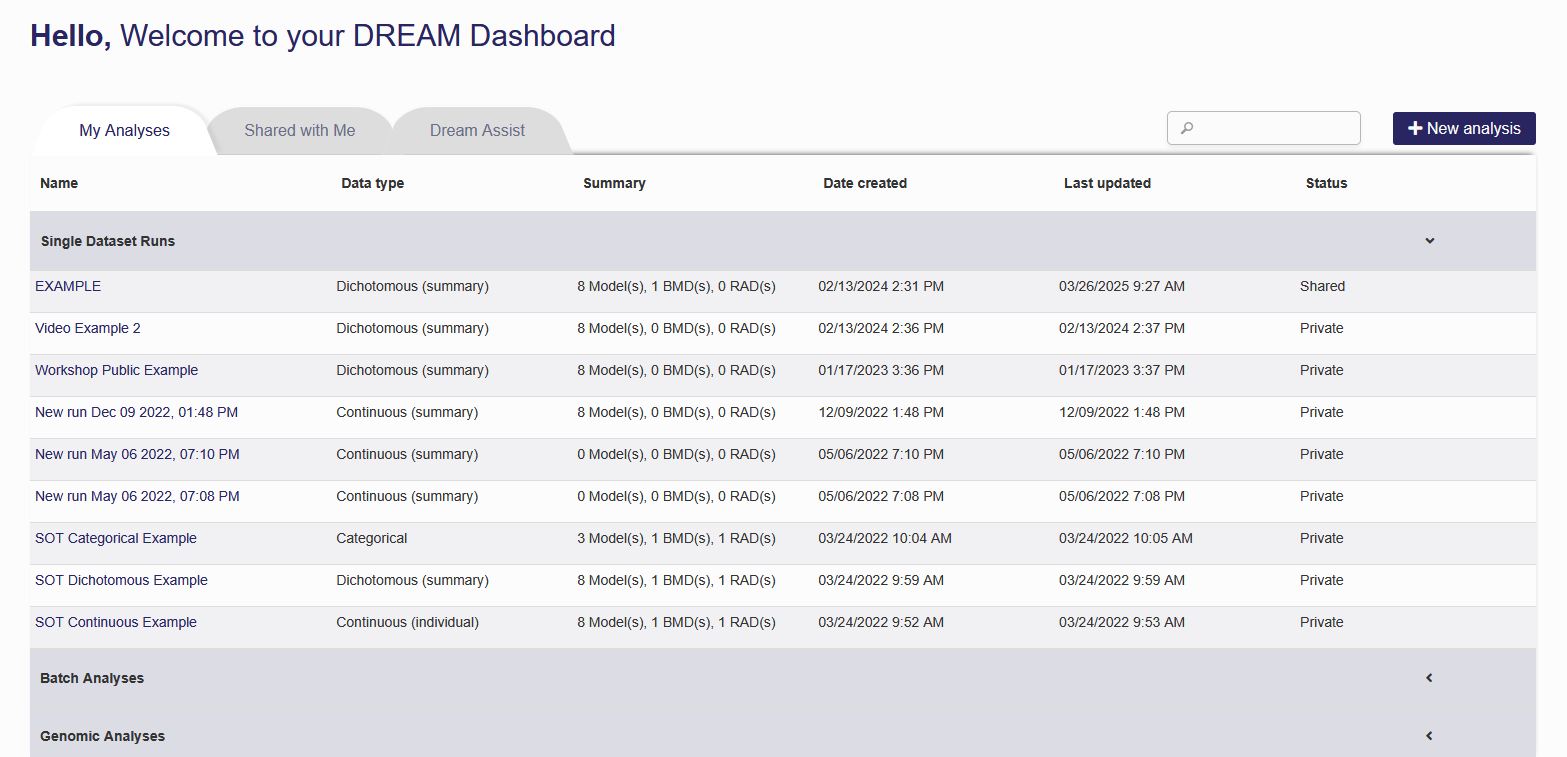
Figure 1.4. The Summary Page of Existing Runs
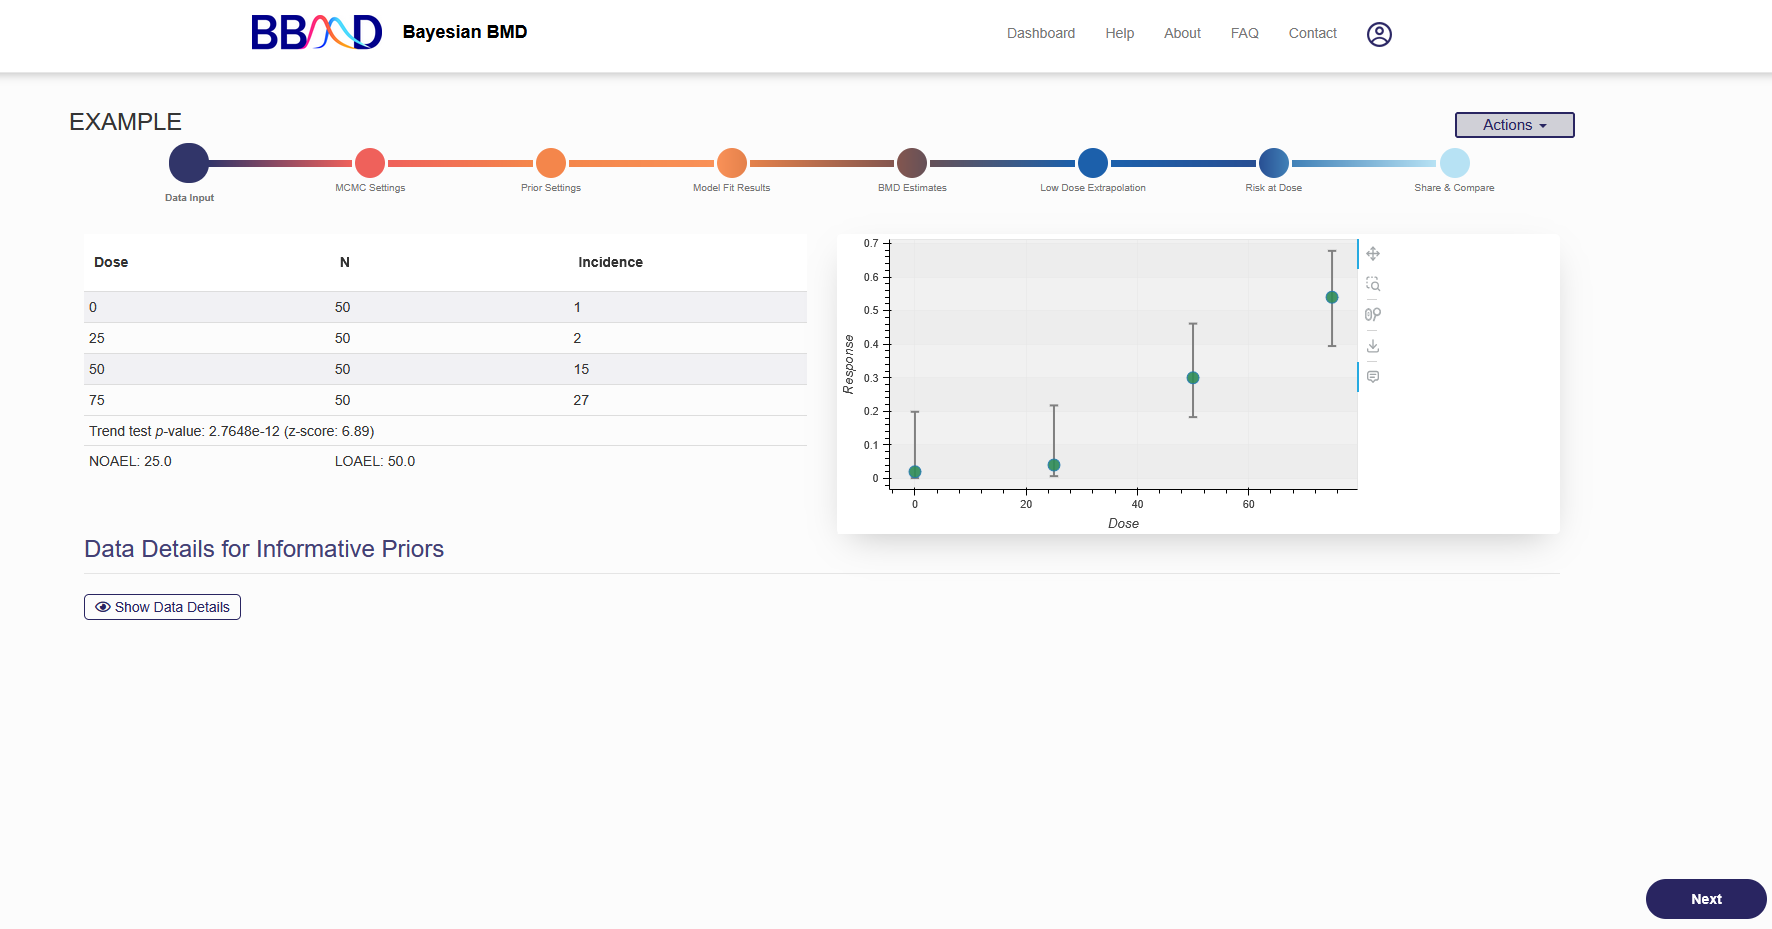
Figure 1.5. Reviewing an Existing Analysis
How to edit a previous analysis
You can also edit previous analysis. The pull-down menu of “Action” in Figure 1.6 has the “Update”, “Delete”, and “Edit a Copy” options. “Update” takes you to the editing phase of an analysis session where you can specify analysis settings and execute analysis estimations. Selecting “Delete” will prompt you to confirm you want to delete this analysis. If you choose to delete an analysis, the analysis and all results will be removed from your profile. Selecting “Edit a Copy” will create an editable copy of a previous analysis.
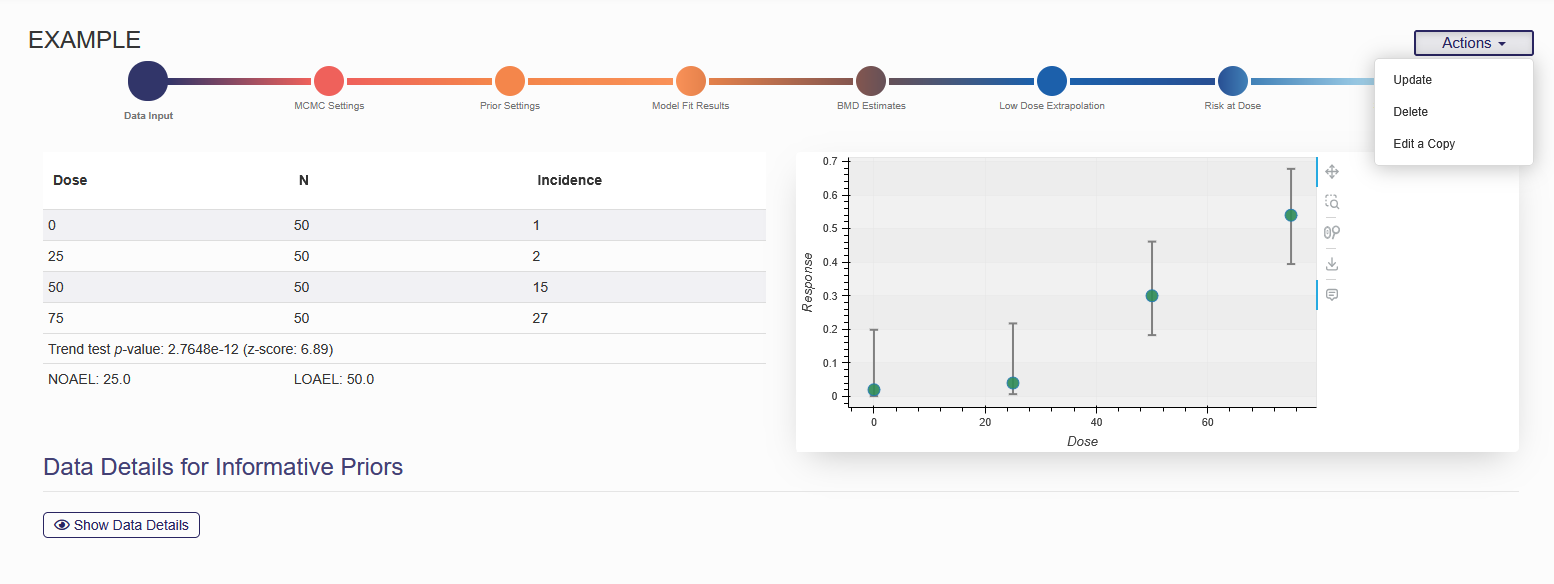
Figure 1.6. The Actions Available to Users for an Existing Analysis
How to share a previous analysis
The final tab in every type of analysis is the “Share” tab, shown in Figure 1.7. From this page you can send your analysis to yourself, share your analysis with the public, allow other people to edit the analysis, and even send your analysis to the DREAM Tech team who can assist with the analysis. If wish to share your analysis with the public, you will be given a share link which can be sent to different users. You can also invite users directly using their account email.
Under the “share” tab, you may also be able to export the results of the analysis into Word or Excel formats, depending on the type of analysis. Exporting the results will send a link to your account’s email where you can download the reports.
At the bottom, you can compare the BMD estimates generated by the BBMD system with those from the EPA’s BMD calculations. Please note you must have at least 1 BMR definition. By clicking the button “Execute”, your data will be sent to the EPA's BMDS online server for executing.
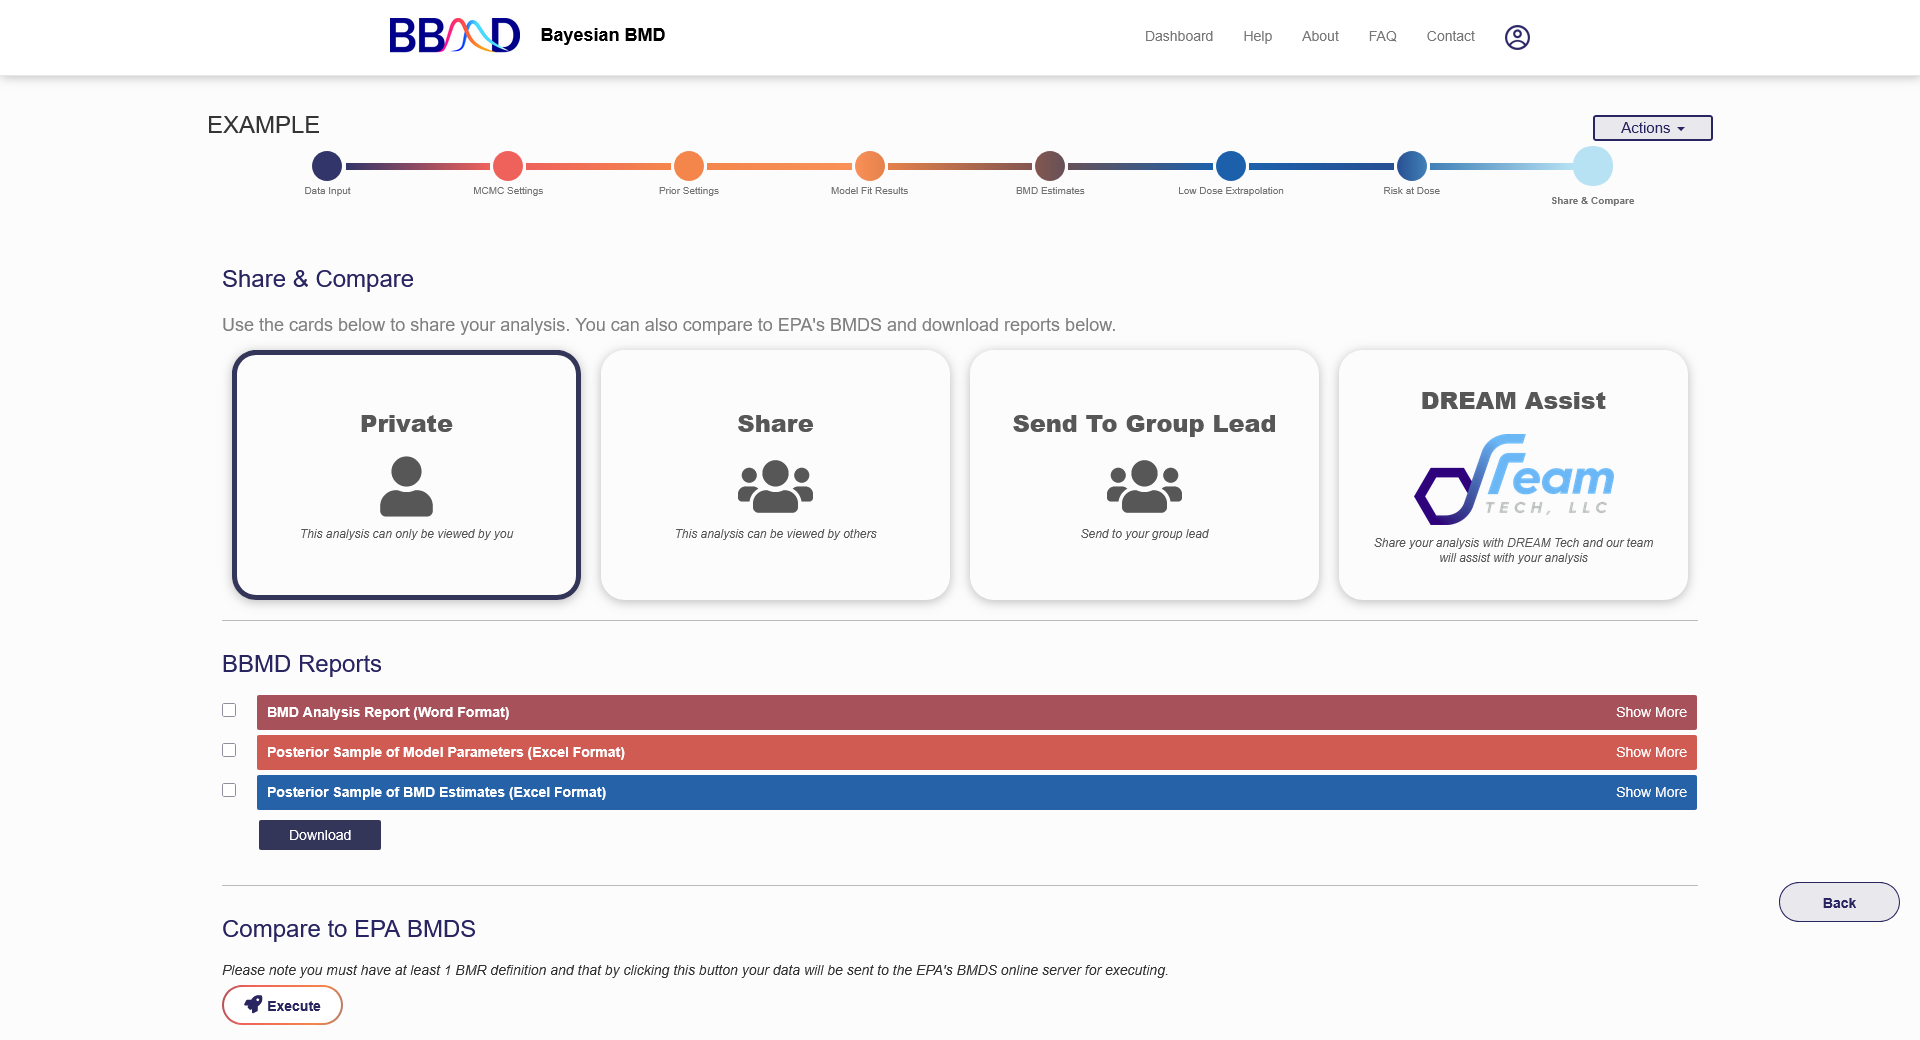
Figure 1.7. Sharing an analysis
Add New Analyses
To start a new analysis from scratch, click “New analysis” in the top right corner in Figure 1.4. When starting a new analysis, you will be asked to select which type of analysis you would like to perform (Figure 1.8). The current analysis types include:
- BMD Analysis for Single Dataset,
- Batch Processing for BMD Analysis,
- BMD Analysis for Genomic Data,
- Probabilistic Reference Dose (RfD) Analysis,
- BMD Analysis for Epidemiological Data,
- Specialty models for multisite tumors and nested dichotomous (coming soon).
After specifying the data type on the analysis selection page, you will be directed to the corresponding module. If the “BMD Analysis for Single Dataset” module or “Batch Processing for BMD Analysis” module is chosen, the data type either continuous or dichotomous or categorical also needs to be specified. If the “Specialty Models” module is chosen, the data type either multisite tumors or nested dichotomous (coming soon) also needs to be specified. These data types are described below. For each type of analysis, a detailed explanation of the required inputs, modeling settings, and model outputs are in sections 2-7.
- Continuous – A continuous response is reported as a measurement of the effect, such as body or tissue weights, in control and exposure groups. The response may be reported in either absolute or relative change from control. When individual data are available, the dose and response data input to BBMD for BMD inference. Instead, when individual data are not available, the summary data are needed including dose level, number of subjects in each dose group, mean value of the response, and the standard deviation or standard error of the response.
- Dichotomous - A dichotomous response is reported as either the presence or absence of an effect. Dichotomous data are reported either as the summary data with the number of animals showing the effect at each individual level or as the individual data with “0” or “1” indicating that the subject is non-affected or affected respectively at each dose level. In BBMD, dichotomous summary data require three values for each dose group (i.e., each input row): dose level, total number of subjects in that group, and the number of subjects affected. Dichotomous individual data require two values for each input row (representing each subject): dose level, and “0” or “1” indicating that the subject is non-affected or affected respectively.
- Categorical – A categorical response is classified as the one or more defined category (e.g., mild, moderate, or severe change) in addition to the no-effect category. This type requires three values for each input row representing each individual subject: dose, severity level, and response.
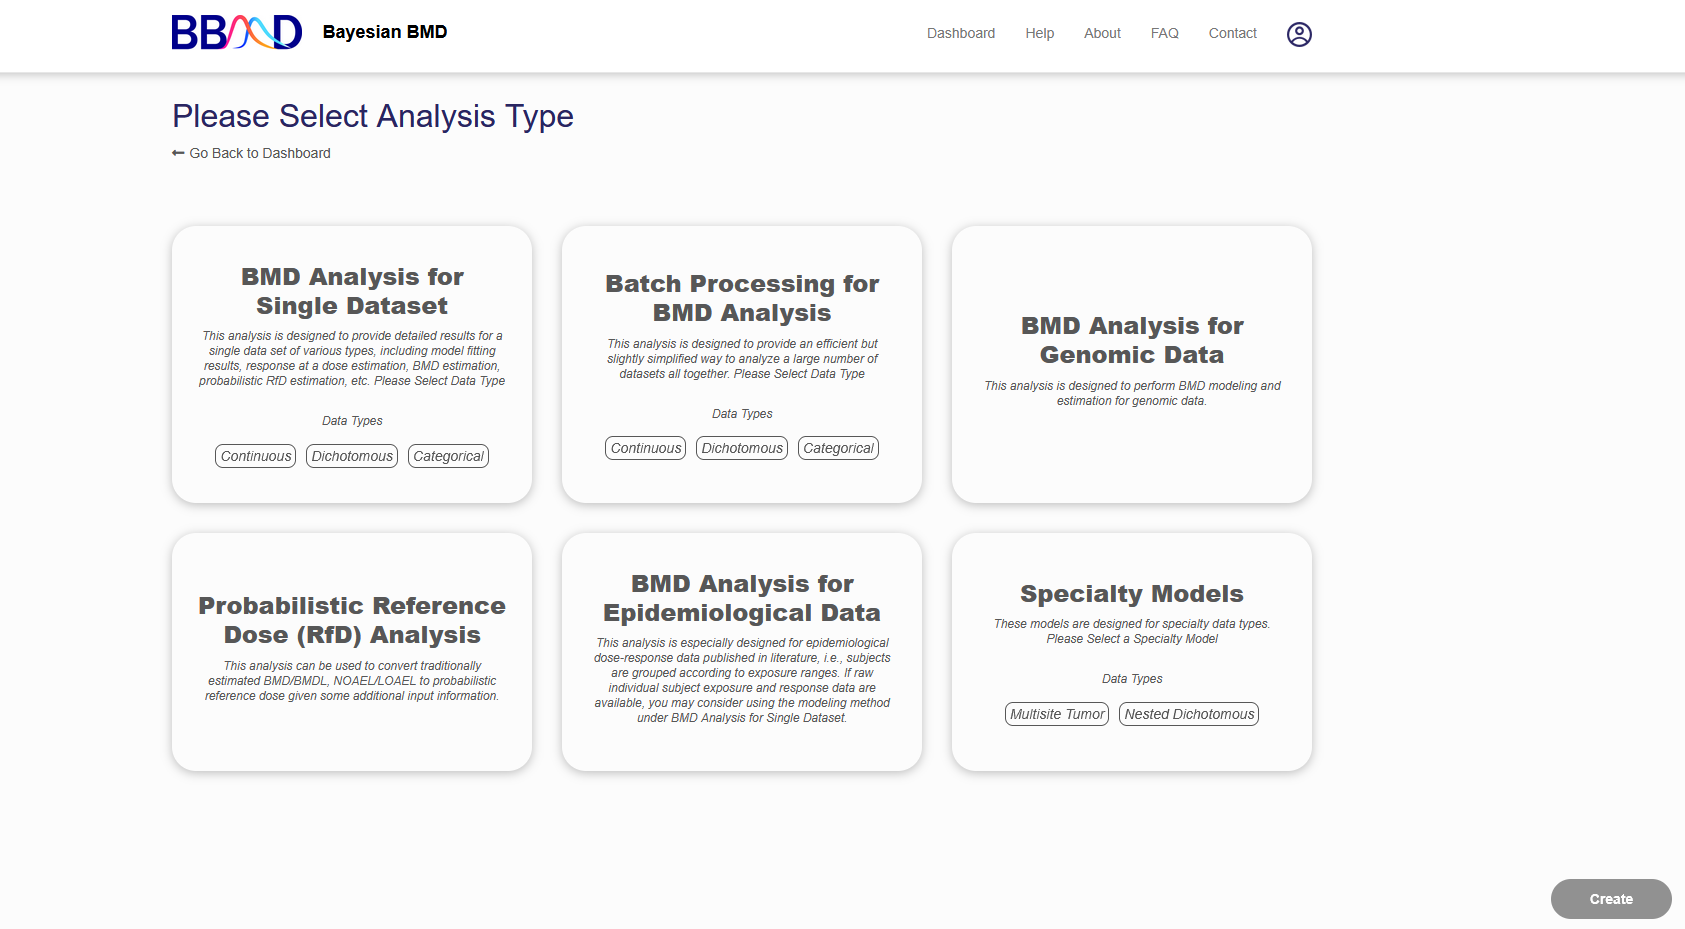
Figure 1.8. Analysis type selection screen when beginning a new analysis
