Probabilistic RfD Analysis
A. Introduction to Probabilistic RfD Analysis
This analysis can be used to convert traditionally estimated BMD/BMDL, NOAEL/LOAEL to probabilistic reference dose given some additional input information.
B. Perform a Probabilistic RfD Analysis
An automatically generated name “New pRfD Month Day Year, HH:MM AM/PM”, is assigned to the newly started analysis. You can click the pencil button next to the analysis name, as seen in Figure 5.1, to make the name more identifiable.
This type of analysis has only two different tabs. The first tab is the data input tab where the analysis settings are specified, the other tab is the share tab.
To perform a Probabilistic RfD analysis, follow the 11 steps below on the “Data Input” tab:
- Name the RfD analysis in the “RfD analysis name” box
- Specify the dose units in the “Dose Units” box (This is not a required step)
(Optional) Choose a random seed for the “Random number seed” box
- Input your prior BMD/BMDL or NOAEL/LOAEL data. If you choose to use a BMD/BMDL analysis as your point of departure selection, you must input the BMD value and BMDL value in the corresponding text boxes. If you choose to use a NOAEL analysis as the point of departure, along with the NOAEL, you must also choose an endpoint type from the drop-down list, and input NOAEL to BMD geometric mean and geometric standard deviation in the corresponding text boxes. Lastly, if you choose to use a LOAEL analysis, in addition to the same settings as a NOAEL analysis, you must also input the LOAEL to NOAEL geometric mean and geometric standard deviation in the corresponding text boxes.
- Specify the Allometric Scaling settings. Select a test species from the “Test species” drop-down menu. Specify the test species body weight in the “Test species body weight” box. Choose a human body weight in the “Human body weight” box. Lastly, specify the Allometric scaling exponent mean and standard deviation in the two corresponding boxes.
- Give an Animal to Human Uncertainty geometric mean and geometric standard deviation. These two values go in their respective boxes.
- Specify Duration of Exposure details to extrapolate non-chronic exposures to chronic exposures. Select the duration of exposure from the drop-down menu. Then give the short-term exposure geometric mean and geometric standard deviation in the corresponding boxes.
- (Optional) Add up to two additional uncertainties. Each additional uncertainty requires a name, geometric mean, and geometric standard deviation. These choices go in the respective boxes.
- Specify the Human Variability geometric mean and geometric standard deviation in the corresponding boxes.
- Give the target population-based incidence in the I* box.
Click the “Execute” button to execute the RfD analysis using the settings just specified.
When the analysis is completed, the name will be displayed on the left panel of the screen along with any other analyses. To edit the analysis settings, click the pencil icon on the right side of the page. You can also click the three dots next to the analysis name and choose “Edit RfD”. If you would like to delete this analysis, click the three dots and choose “Delete”. To add a new analysis, press the plus icon above the names of the existing analyses, and then follow steps (1) – (11) again.

Figure 5.1. “Data Input” for a Probabilistic RfD analysis
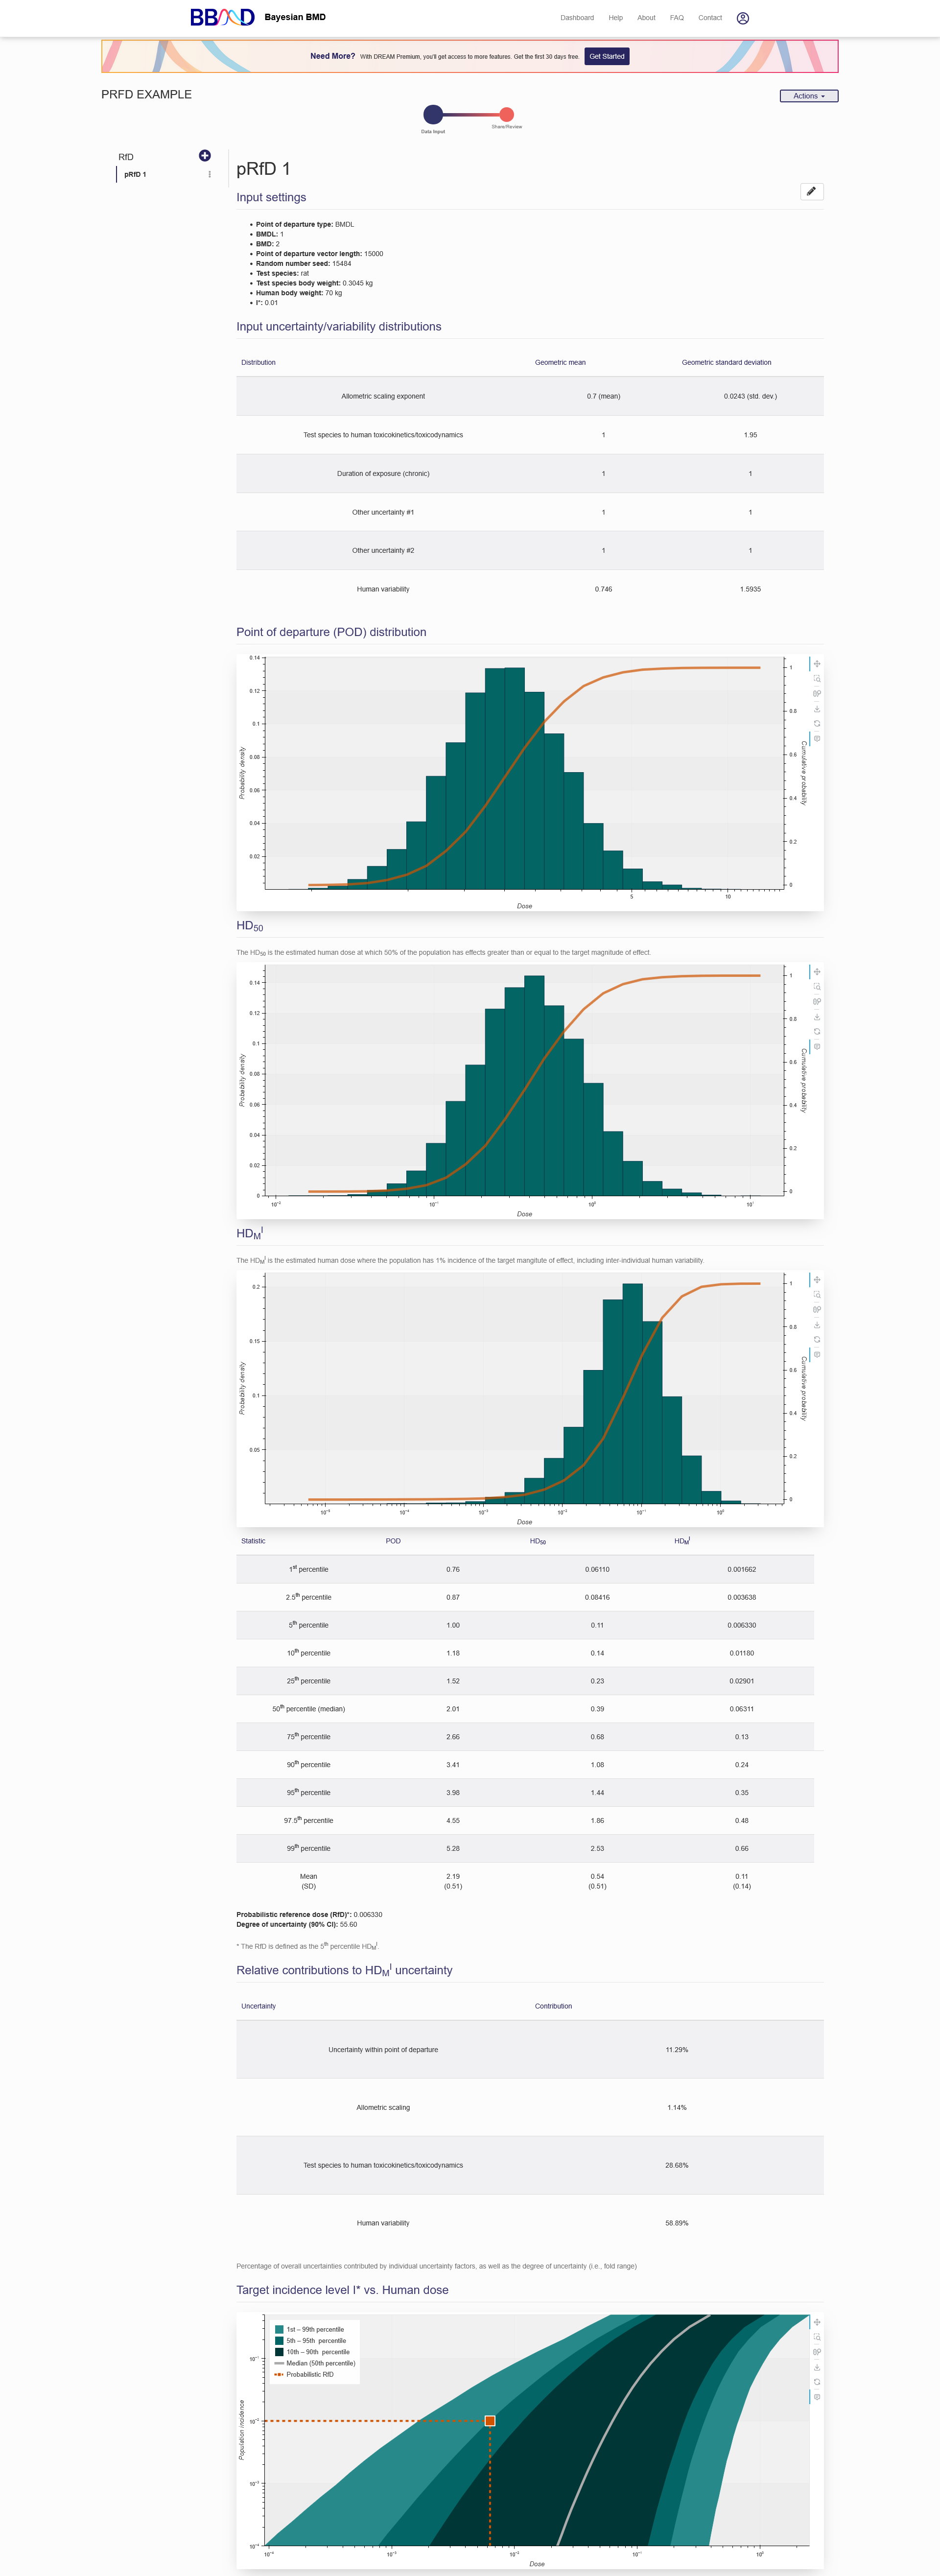
The results, shown in Figure 5.2, will be displayed also be displayed on the “Data Input” tab. The first section in the results is a summary of the analysis settings. The next section is a table containing the input uncertainty/variability distributions. The next result displayed is the Point of departure (POD) distribution plot. The next plot is the HD50, which is the estimated human does at which 50% of the population has effects greater than or equal to the target magnitude of effect. The third plot is the HDMI, the estimated human dose where the population has 1% incidence of the target magnitude of effect, including inter-individual human variability. The next table contains the data in the plots for percentile and the corresponding POD, HD50, and HDMI values. Below this table is the Probabilistic reference dose (RfD) value, defined as the 5th percentile HDMI, and the degree of uncertainty (90% CI). The next table is the relative contributions to HDMI uncertainty. The final plot shows the target incidence level I* vs. Human dose.

Figure 5.2. Results from a pRfD analysis
C. Interpret Probabilistic RfD Analysis Results
With the derived point of departure (POD) from an animal model and the user defined uncertainty factors, this POD is extrapolated to the equivalent human exposure (e.g., daily oral equivalent dose). Based on the dose response relationship of human extrapolation, the HD50 (50% of the population has effects greater than or equal to the target magnitude of effect) and HDMI (estimated human dose where the population has 1% incidence of the target magnitude of effect, including inter-individual human variability) are derived on the RfD results page. The dose-population incidence curve below the summary table gives a visual expression of the statistic values in the HDMI table. In addition, the contributions of uncertainty from each individual uncertainty factors are also summarized in the table on the RfD results page.
